Incidents and referrals
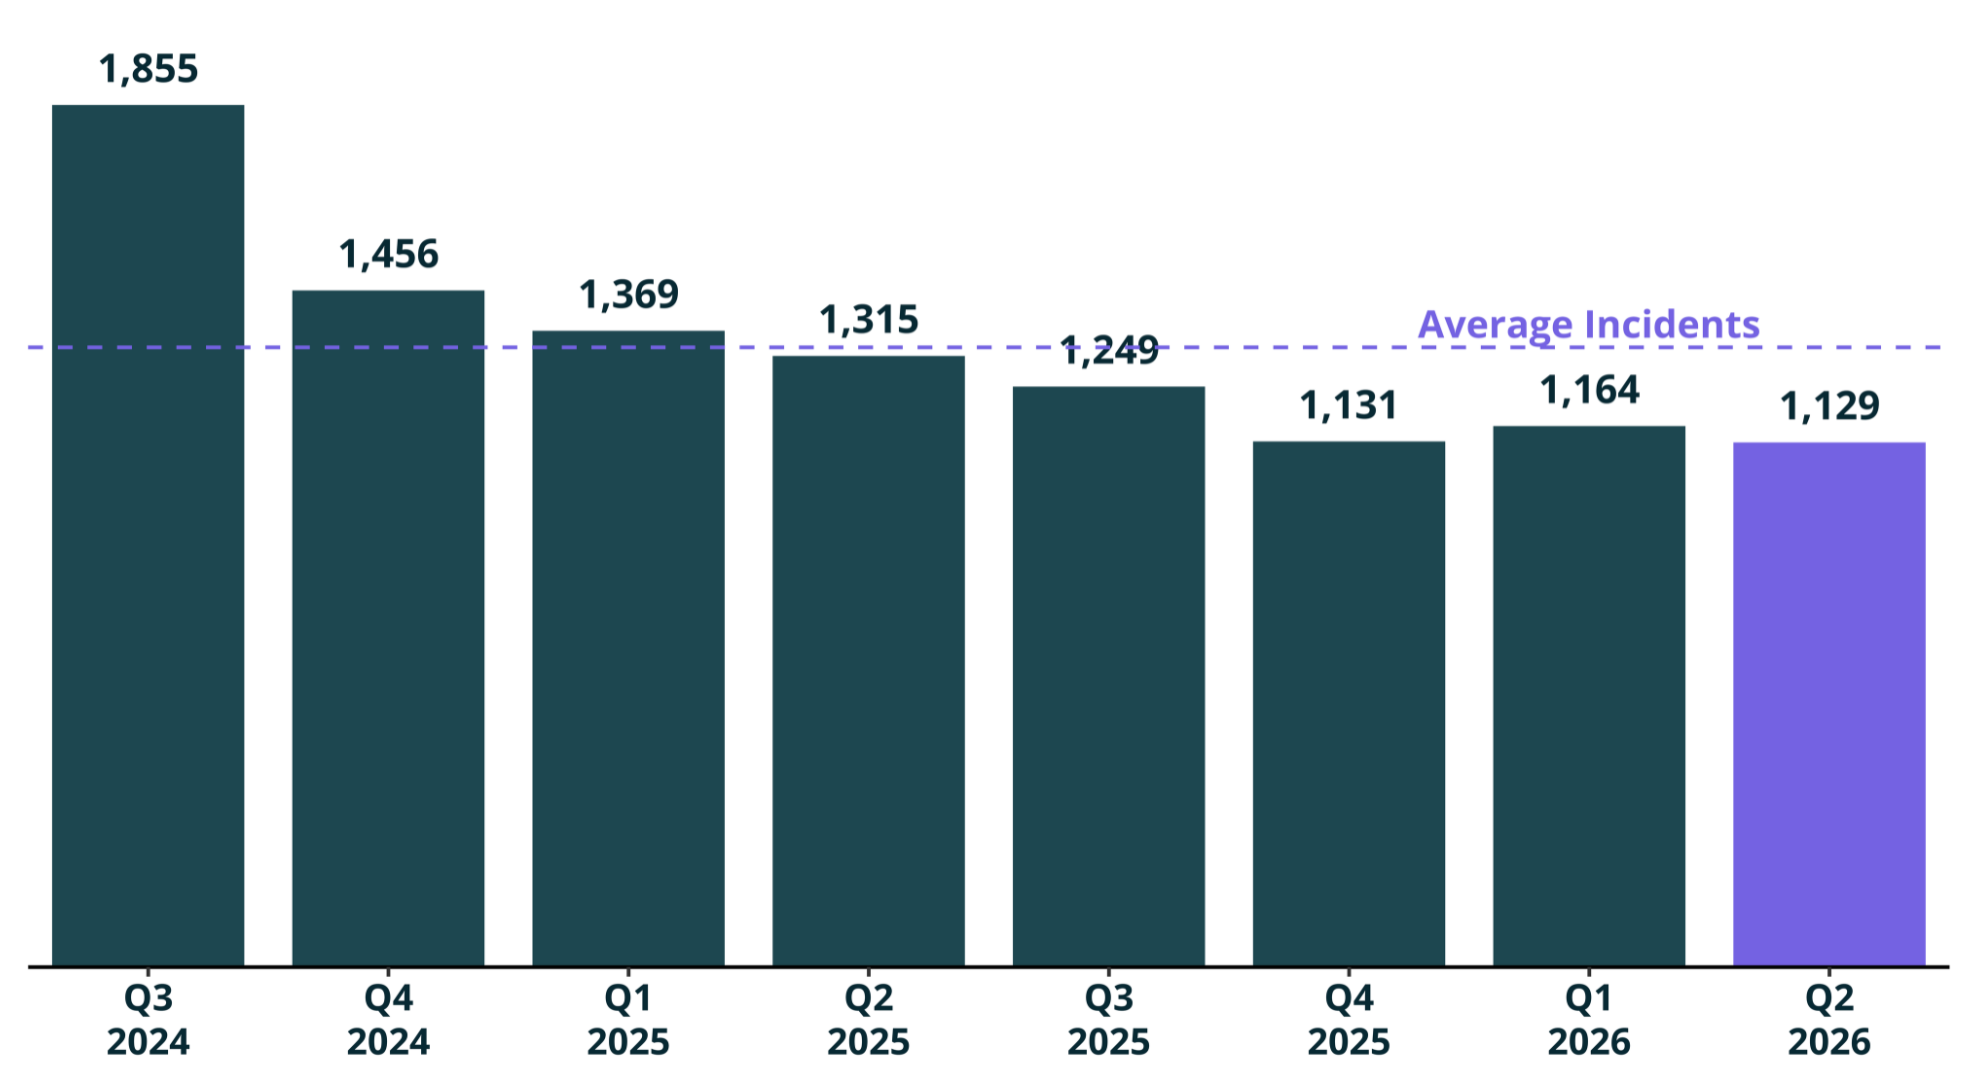
Between 1 April and 30 June 2026, a total of 1,129 incidents occurred, of which 1,037 reports did not require specialist technical support.
Of the total incidents:
- 632 were responded to directly by the NCSC,
- 364 were referred to New Zealand Police,
- 98 were referred to the New Zealand Telecommunications Forum (TCF),
- 38 were referred to the Department of Internal Affairs (DIA),
- 8 were referred to the Commerce Commission,
- 1 was referred to the Domain Name Commission (DNC).
The NCSC may refer a single incident to multiple agencies. As such, the above referral numbers may not sum to the total incident count.
Number of incidents reported by quarter
Breakdown by incident category
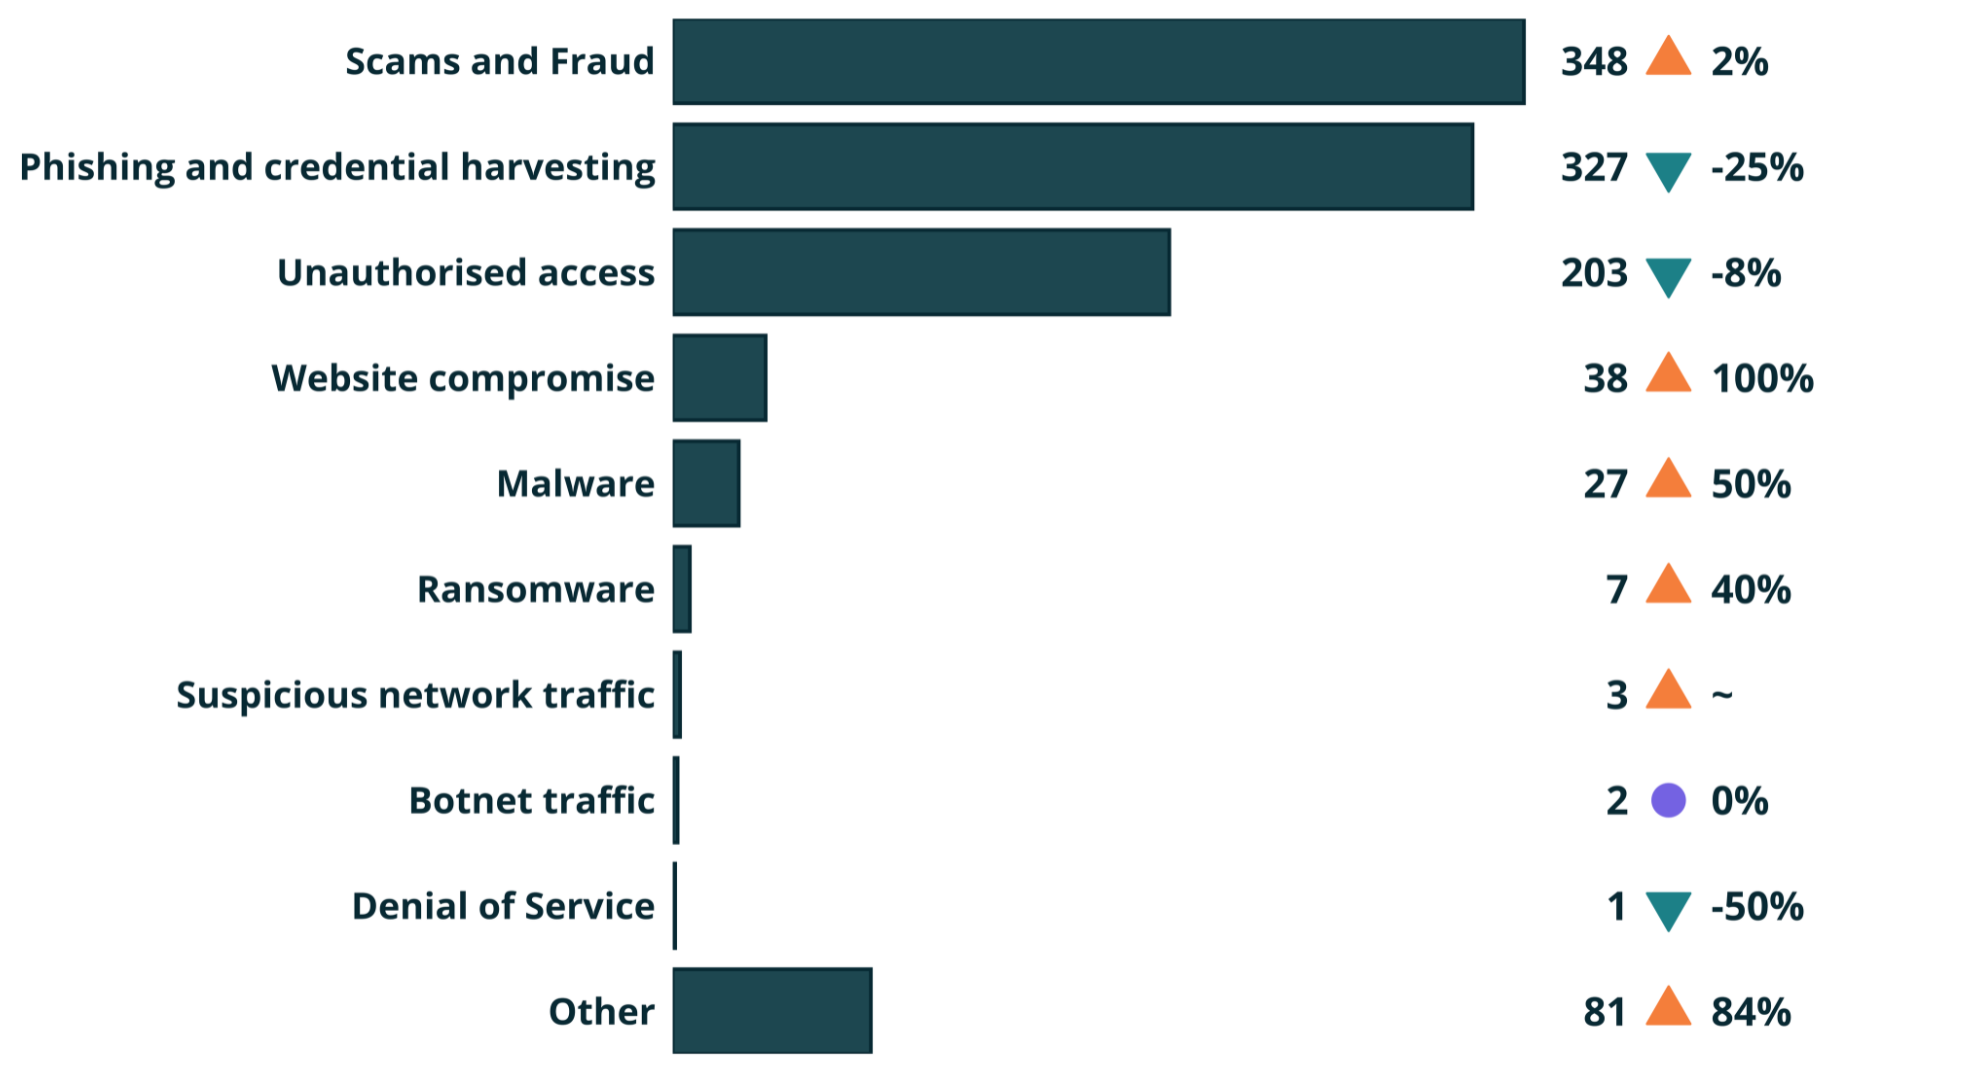
This section includes only the 1,037 reports that did not require specialist technical support.
Scams and fraud became the most common incident category in Q2 2026 and has increased by 2% from 340 in Q1 to 348 in Q2.
Phishing and credential harvesting was the second most common incident category in Q2, decreasing by 25% from 437 in Q1 to 327 in Q2.
Incidents relating to unauthorised access decreased this quarter by 8% from 220 in Q1 to 203 in Q2.
We define all the incident categories in the appendix of this report - more about the incident categories we use. External Link
Incidents affecting individuals
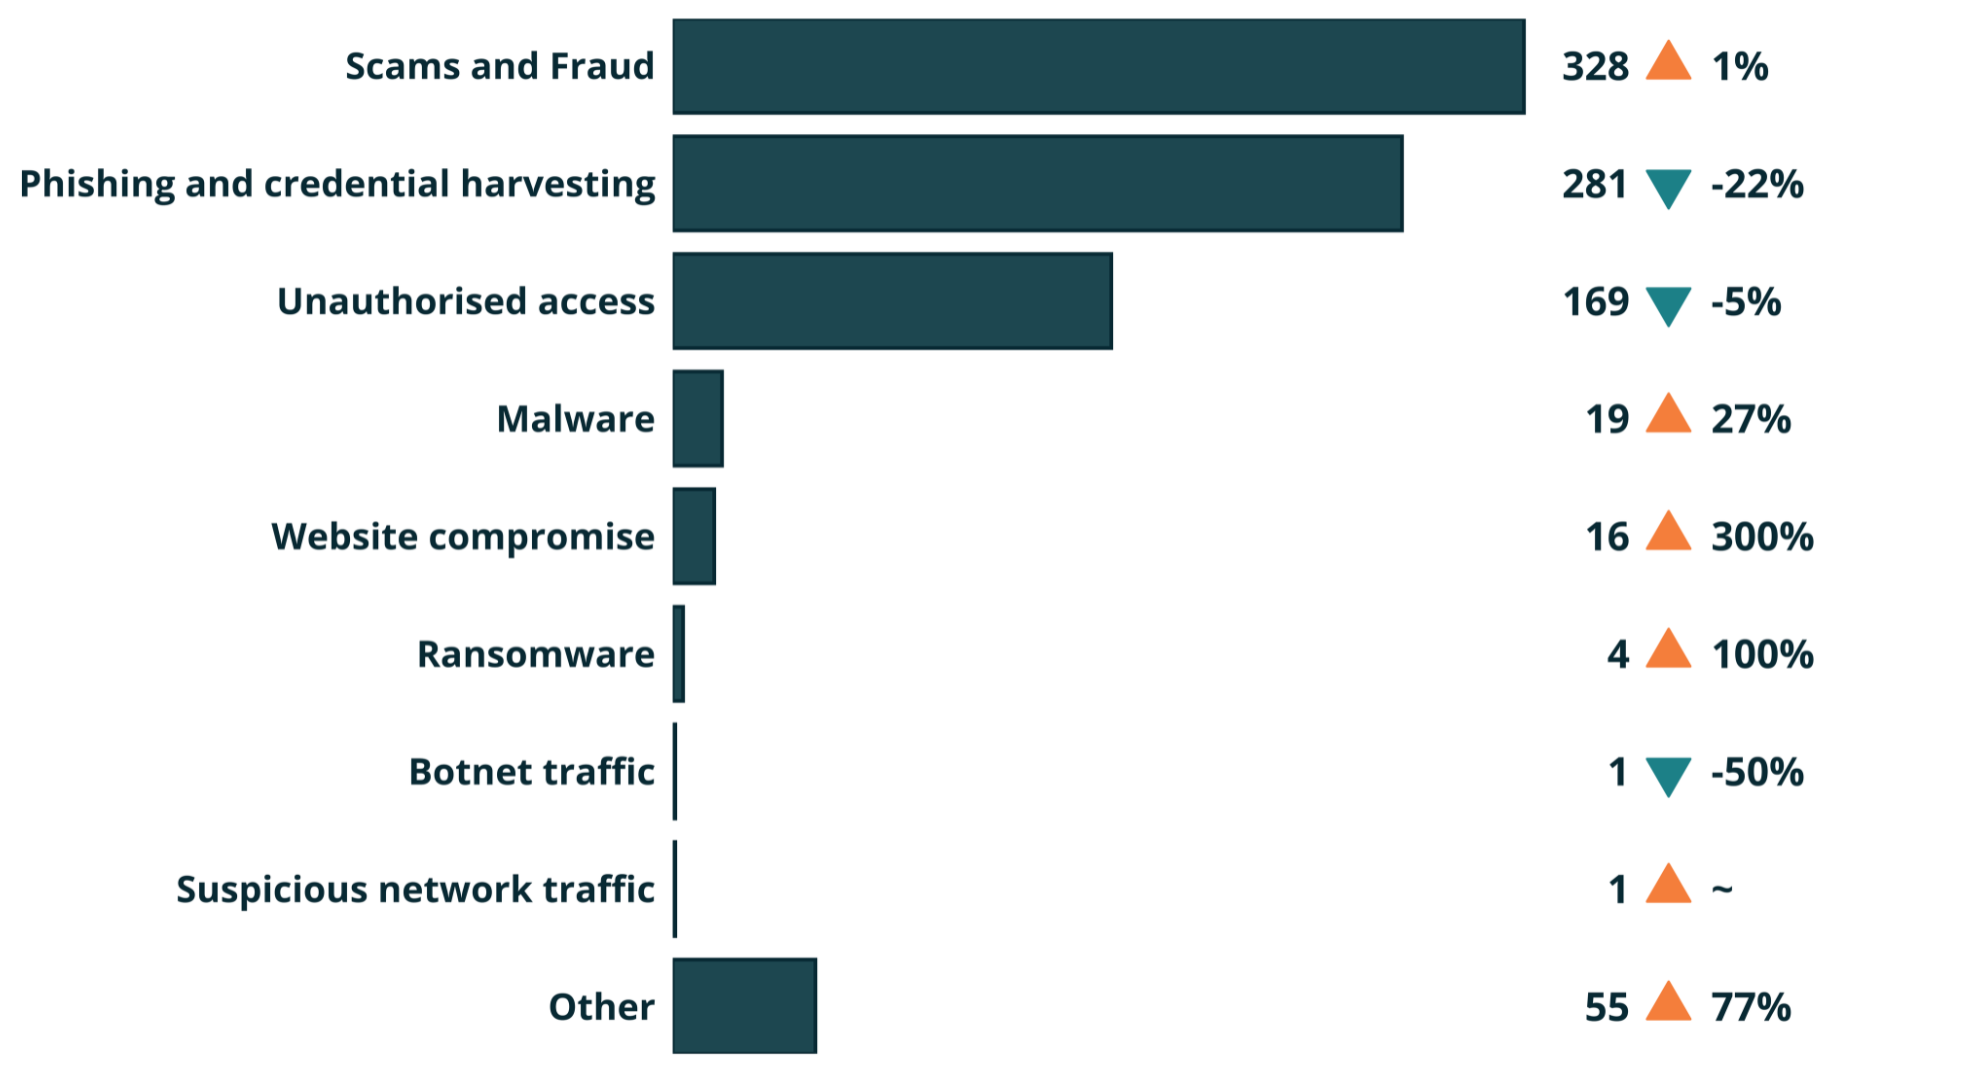
Out of the total of the 1,037 reports that did not require specialist technical support in Q2 2026, 874 (84%) were reported as affecting individuals.
The largest category affecting individuals this quarter is scams and fraud, which accounts for 38% of reports impacting individuals.
Incidents relating to phishing and credential harvesting for individuals decreased by 22% from 359 in Q1 to 281 in Q2.
Incidents affecting organisations
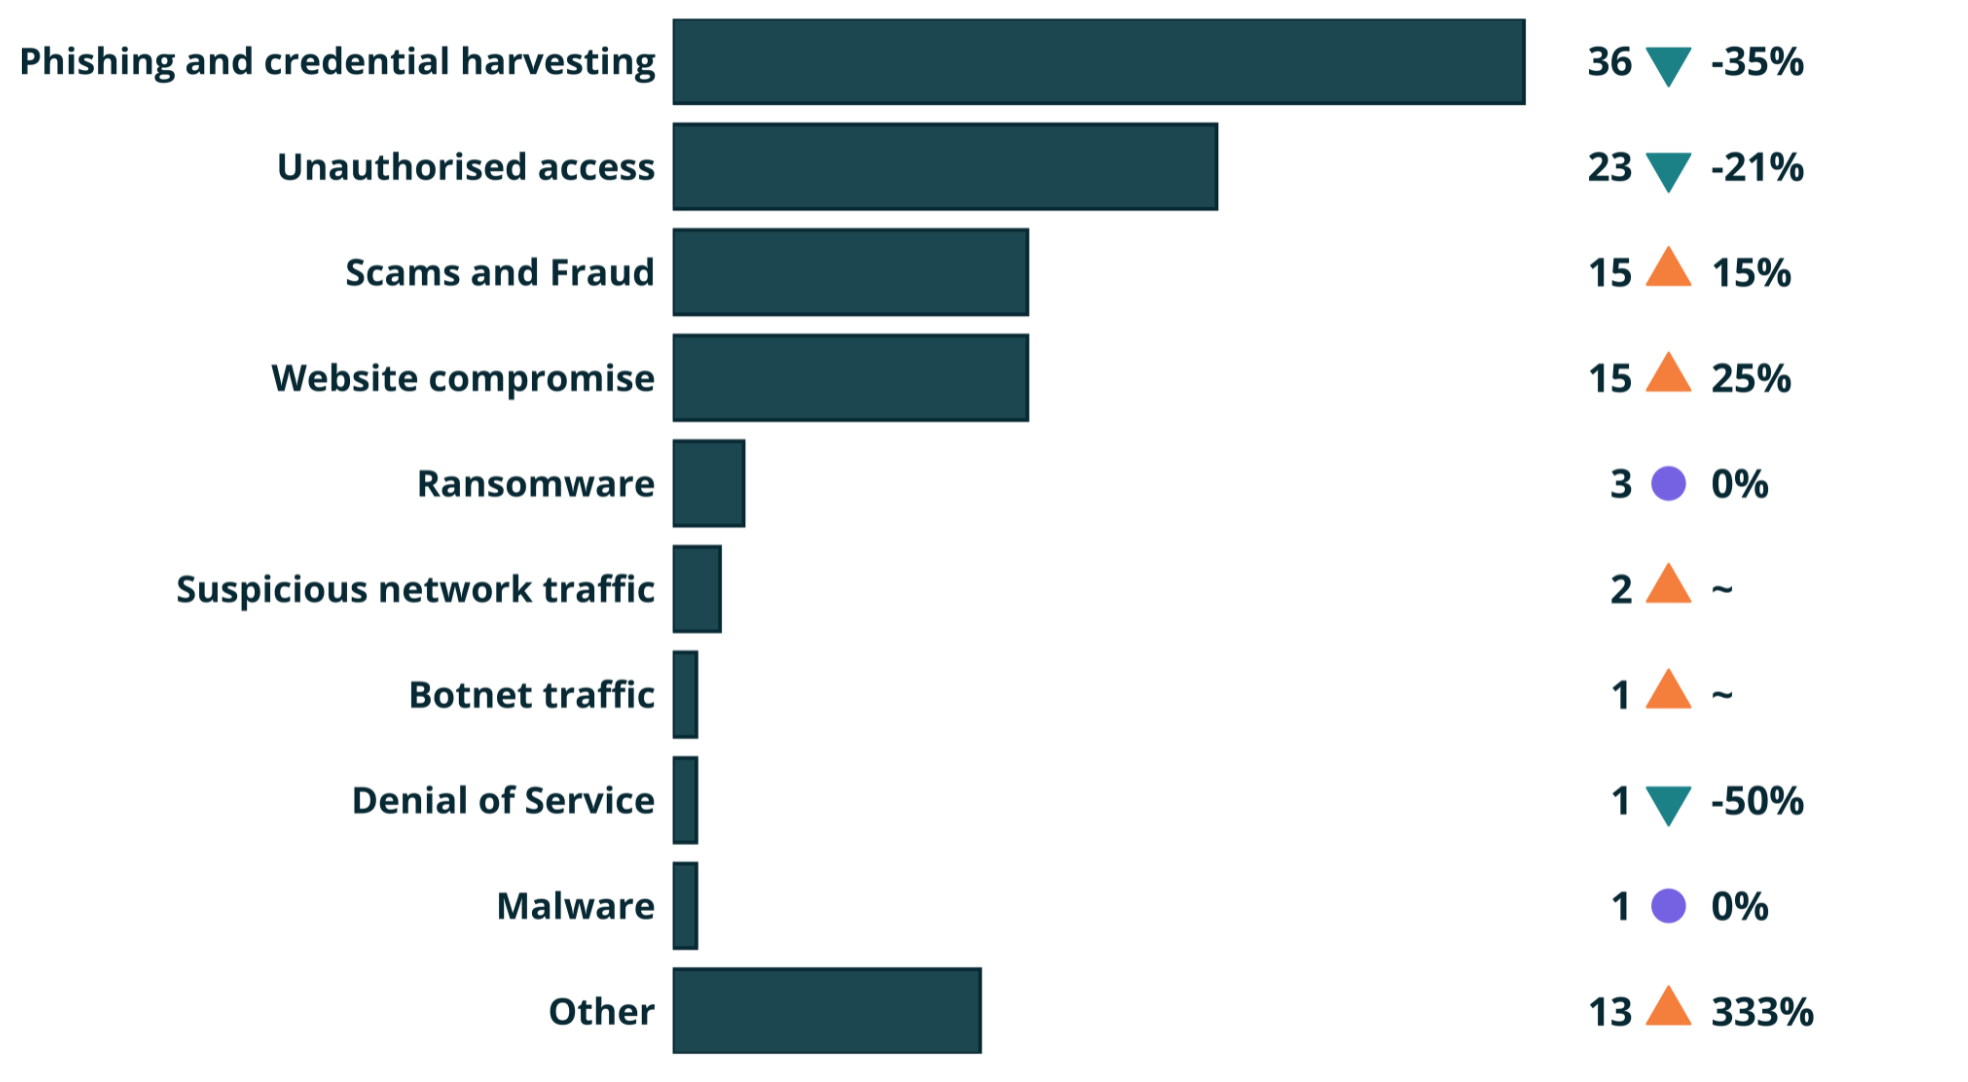
Out of the total of the 1,037 reports that did not require specialist technical support in Q2 2026, 110 incidents (11%) affected organisations.
Phishing and credential harvesting continues to be the largest category of incidents reported to us by organisations, accounting for 33% of incidents affecting organisations processed through our triage process during Q2.
Demographics: Reporting by sector
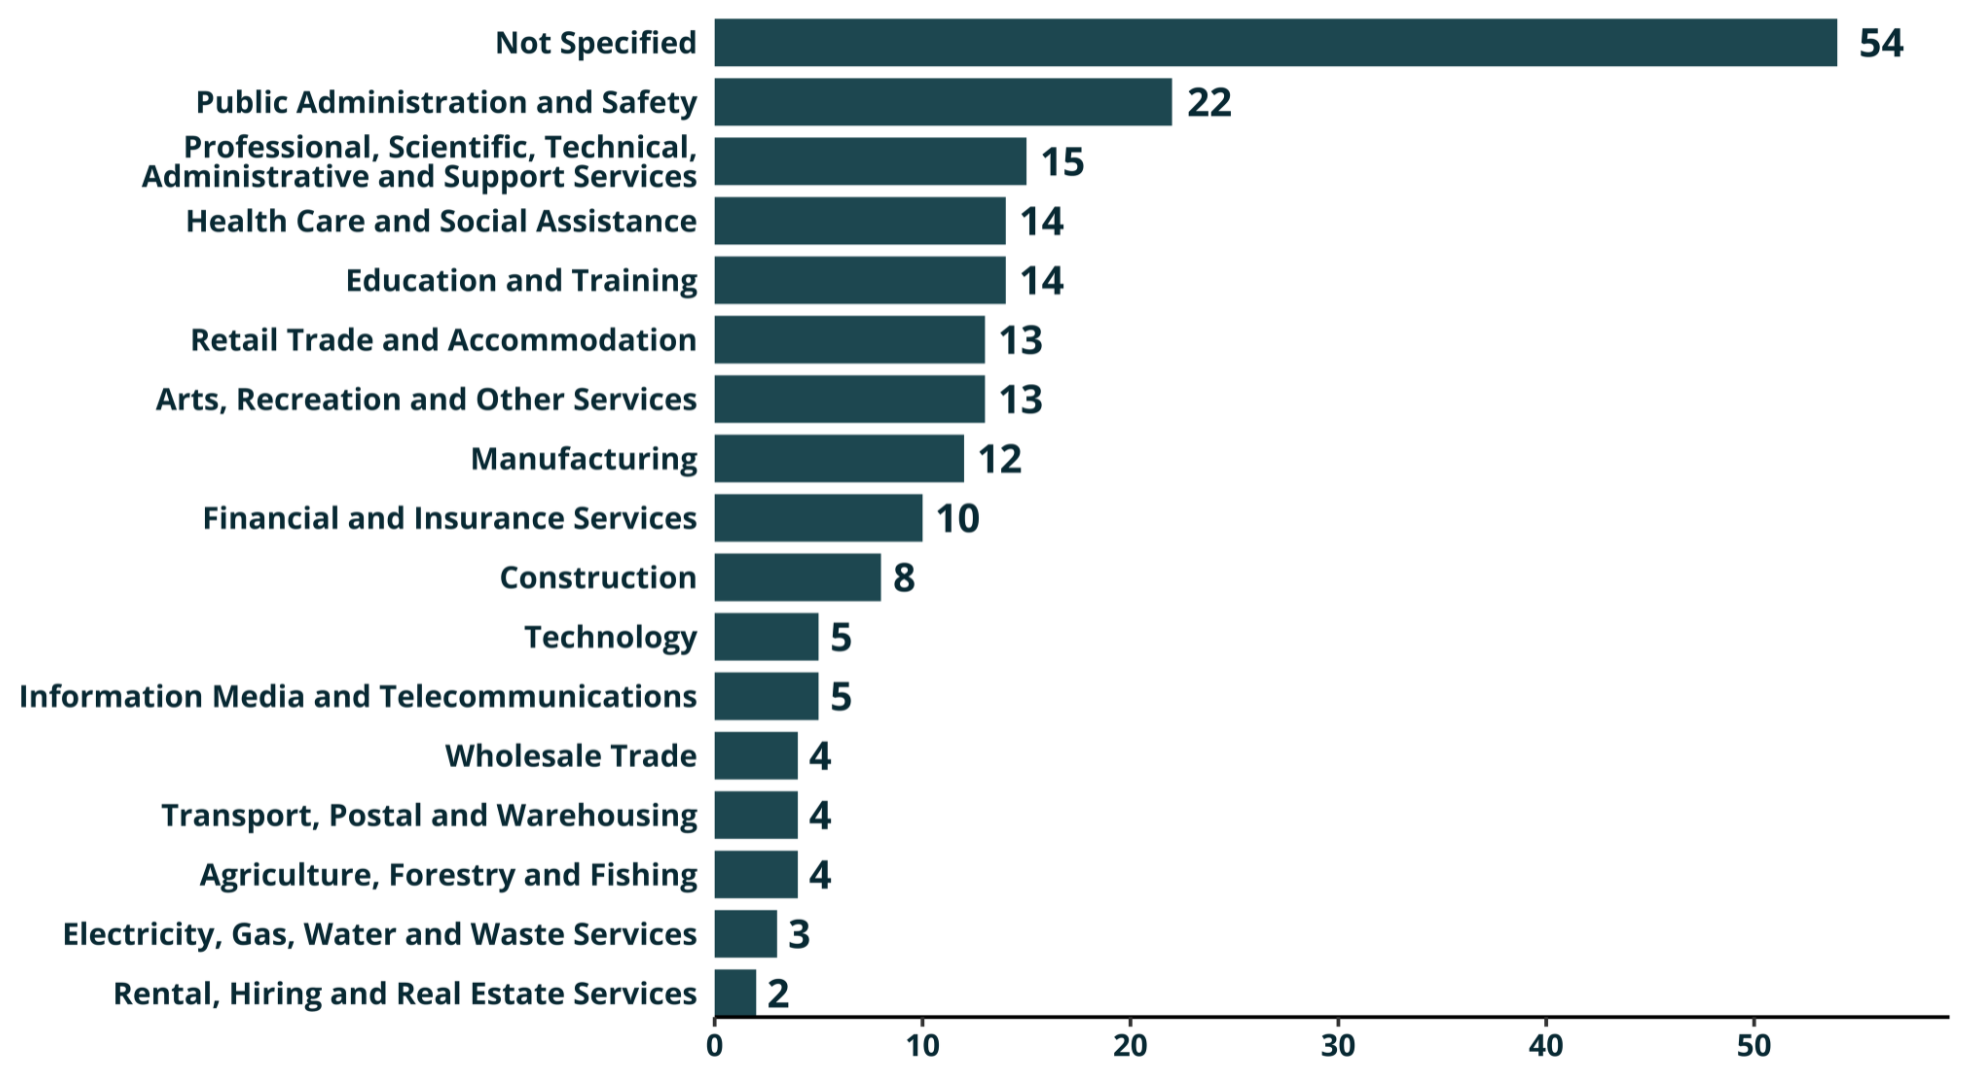
Of all incident reports that provided sector information, Public Administration and Safety is the most reported sector this quarter.
Demographics: Reporting by age
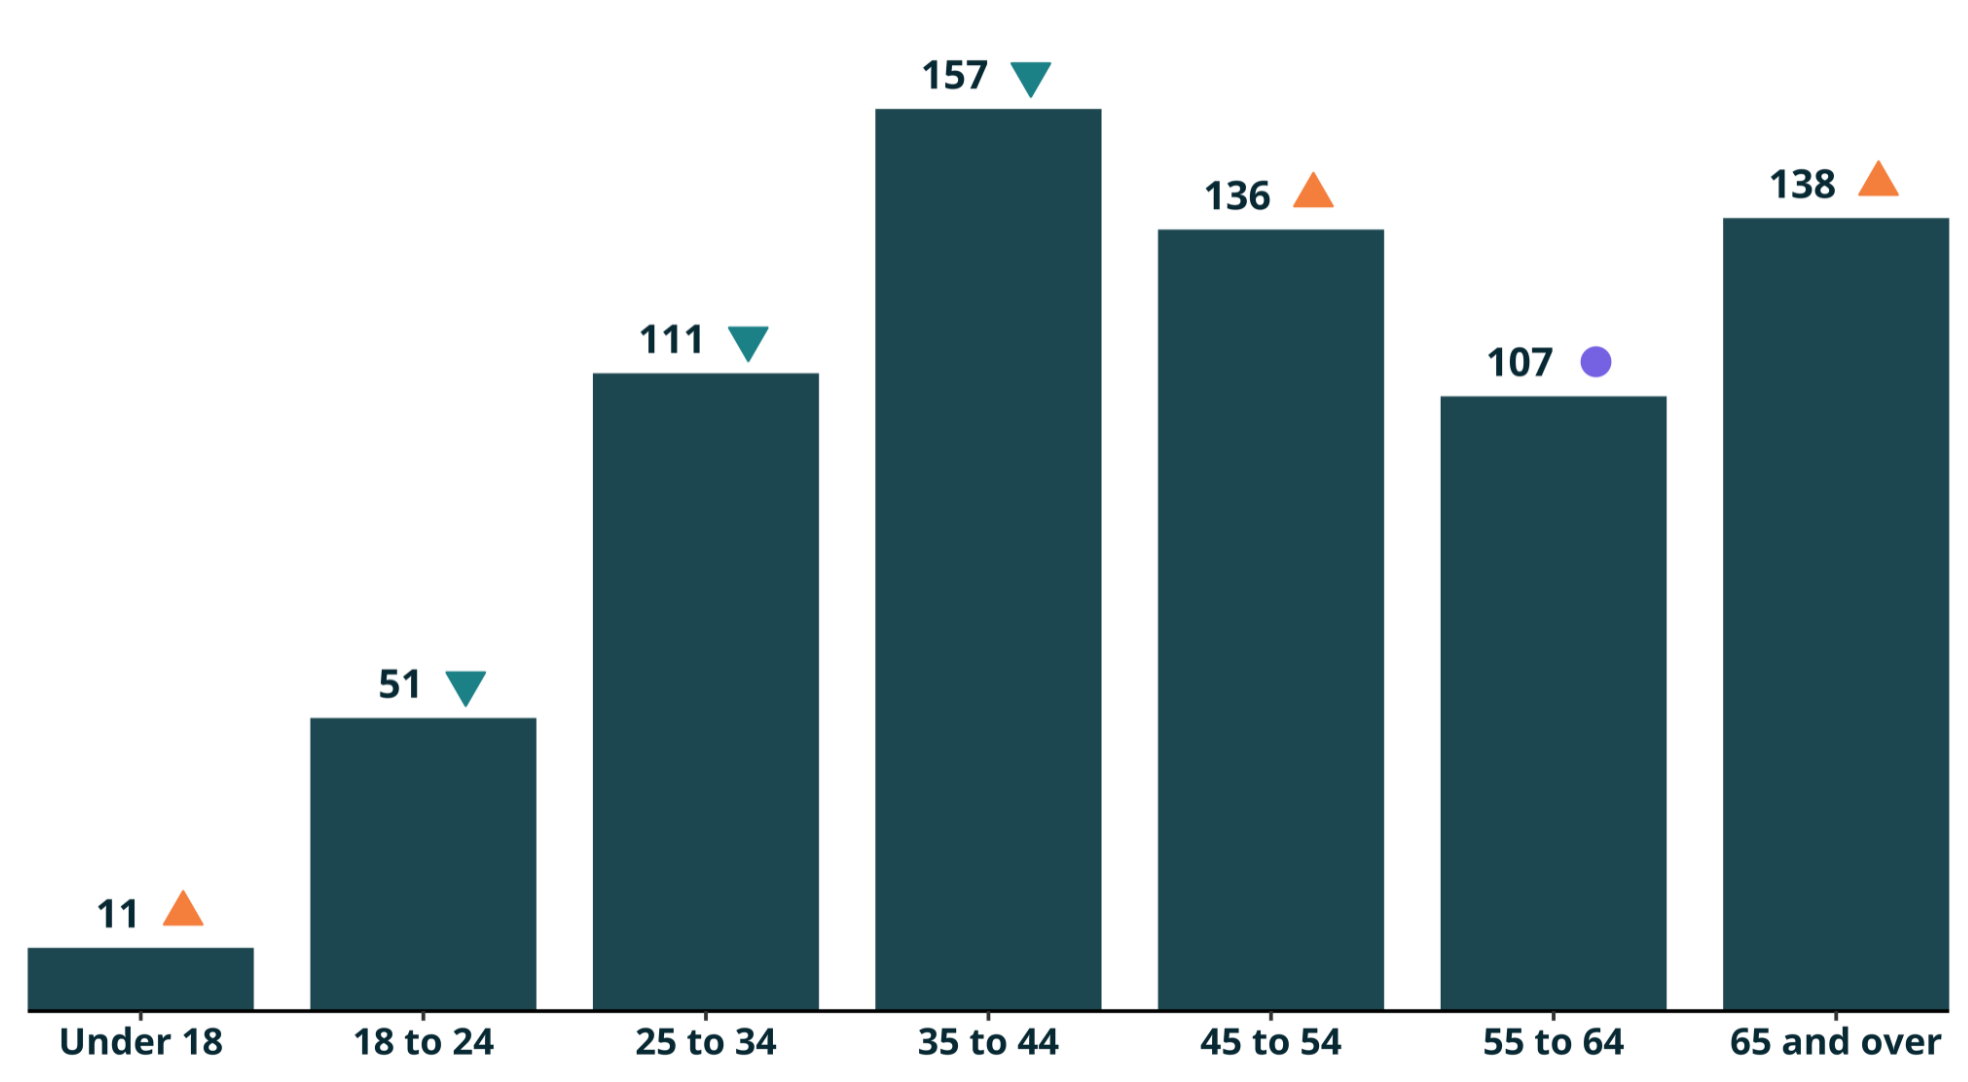
Of the 874 incidents affecting individuals, 717 (82%) provided their date of birth.
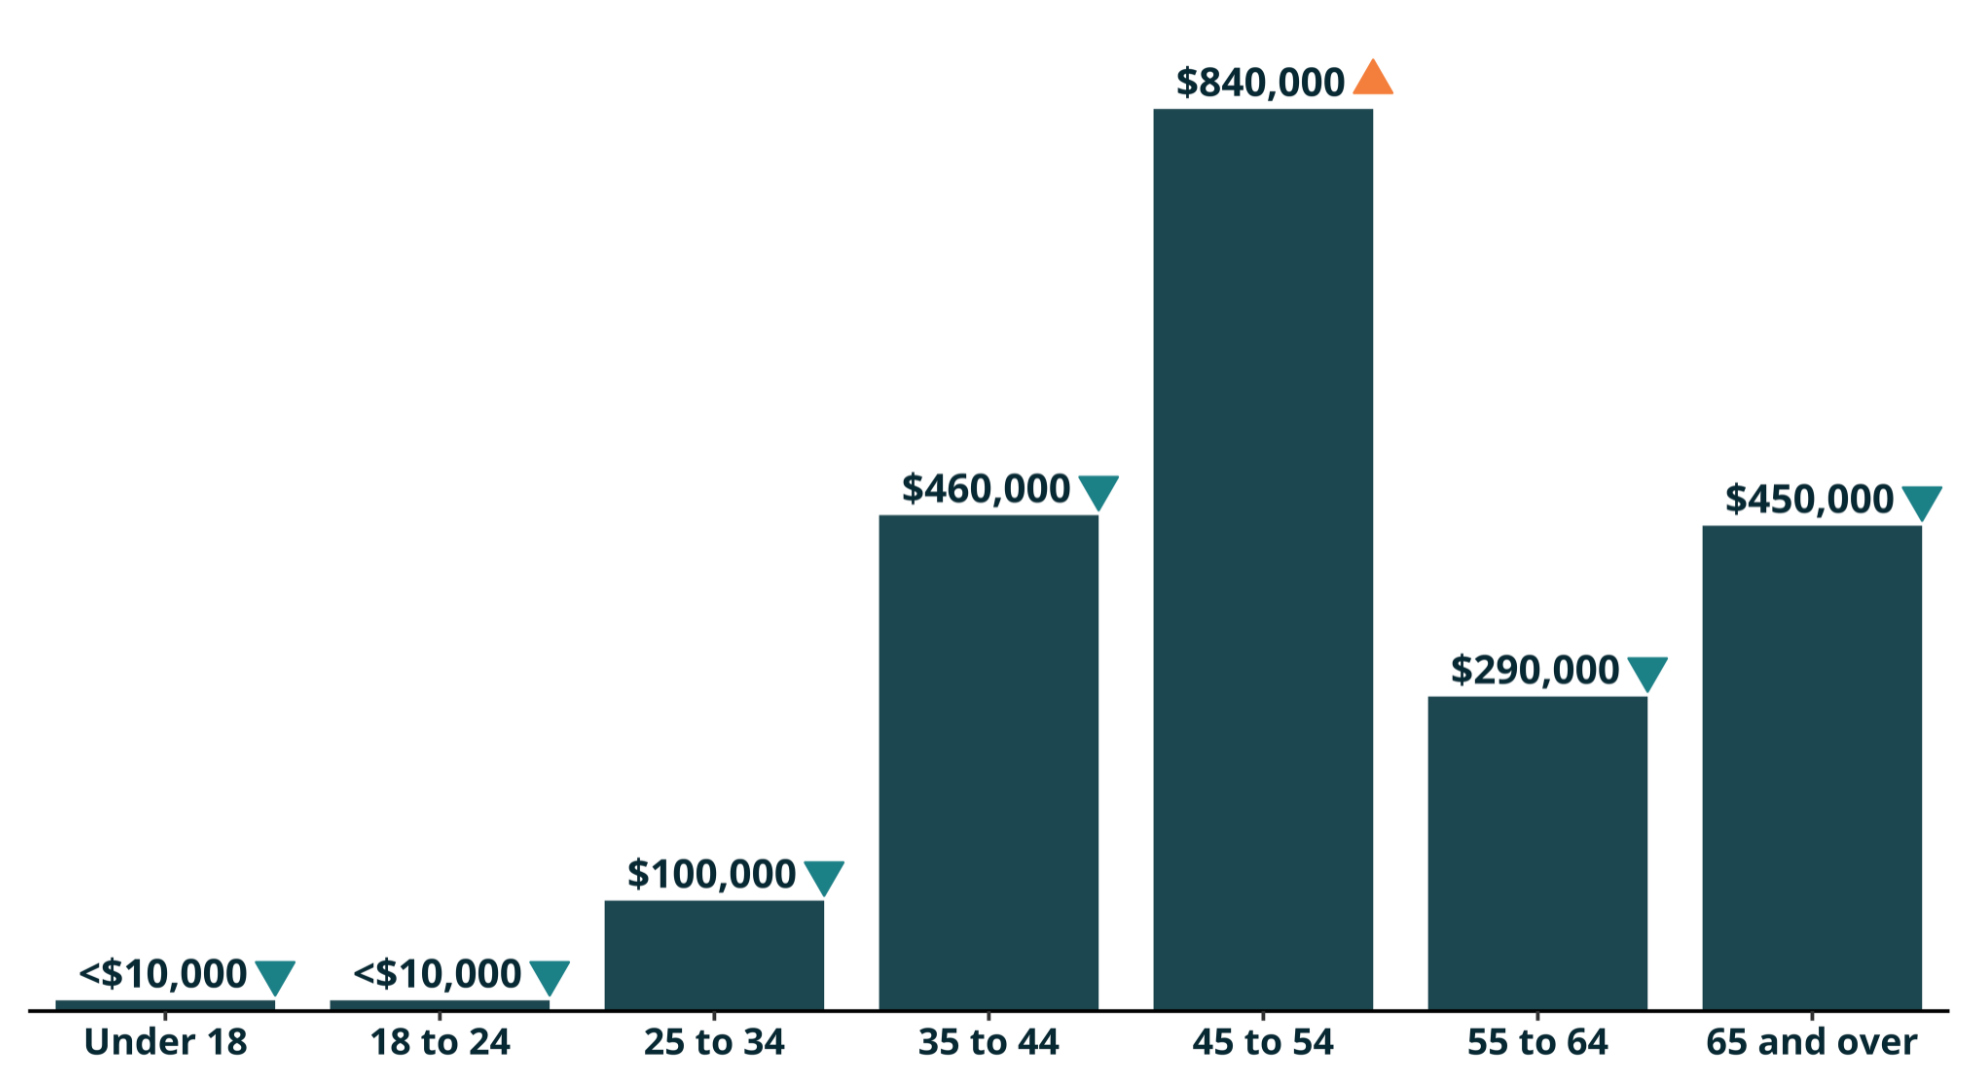
The most common age band given was reporters aged 35 to 44, accounting for 22% of reports where a date of birth was provided, the losses incurred by this age group were ~$460K.
Reporters in the 45 to 54 age bracket incurred the highest losses, of those age groups providing data, with a total of ~$840K.
Incidents affecting individuals - breakdown by age
Incidents affecting individuals - financial loss by age
Impact: Direct Financial Loss
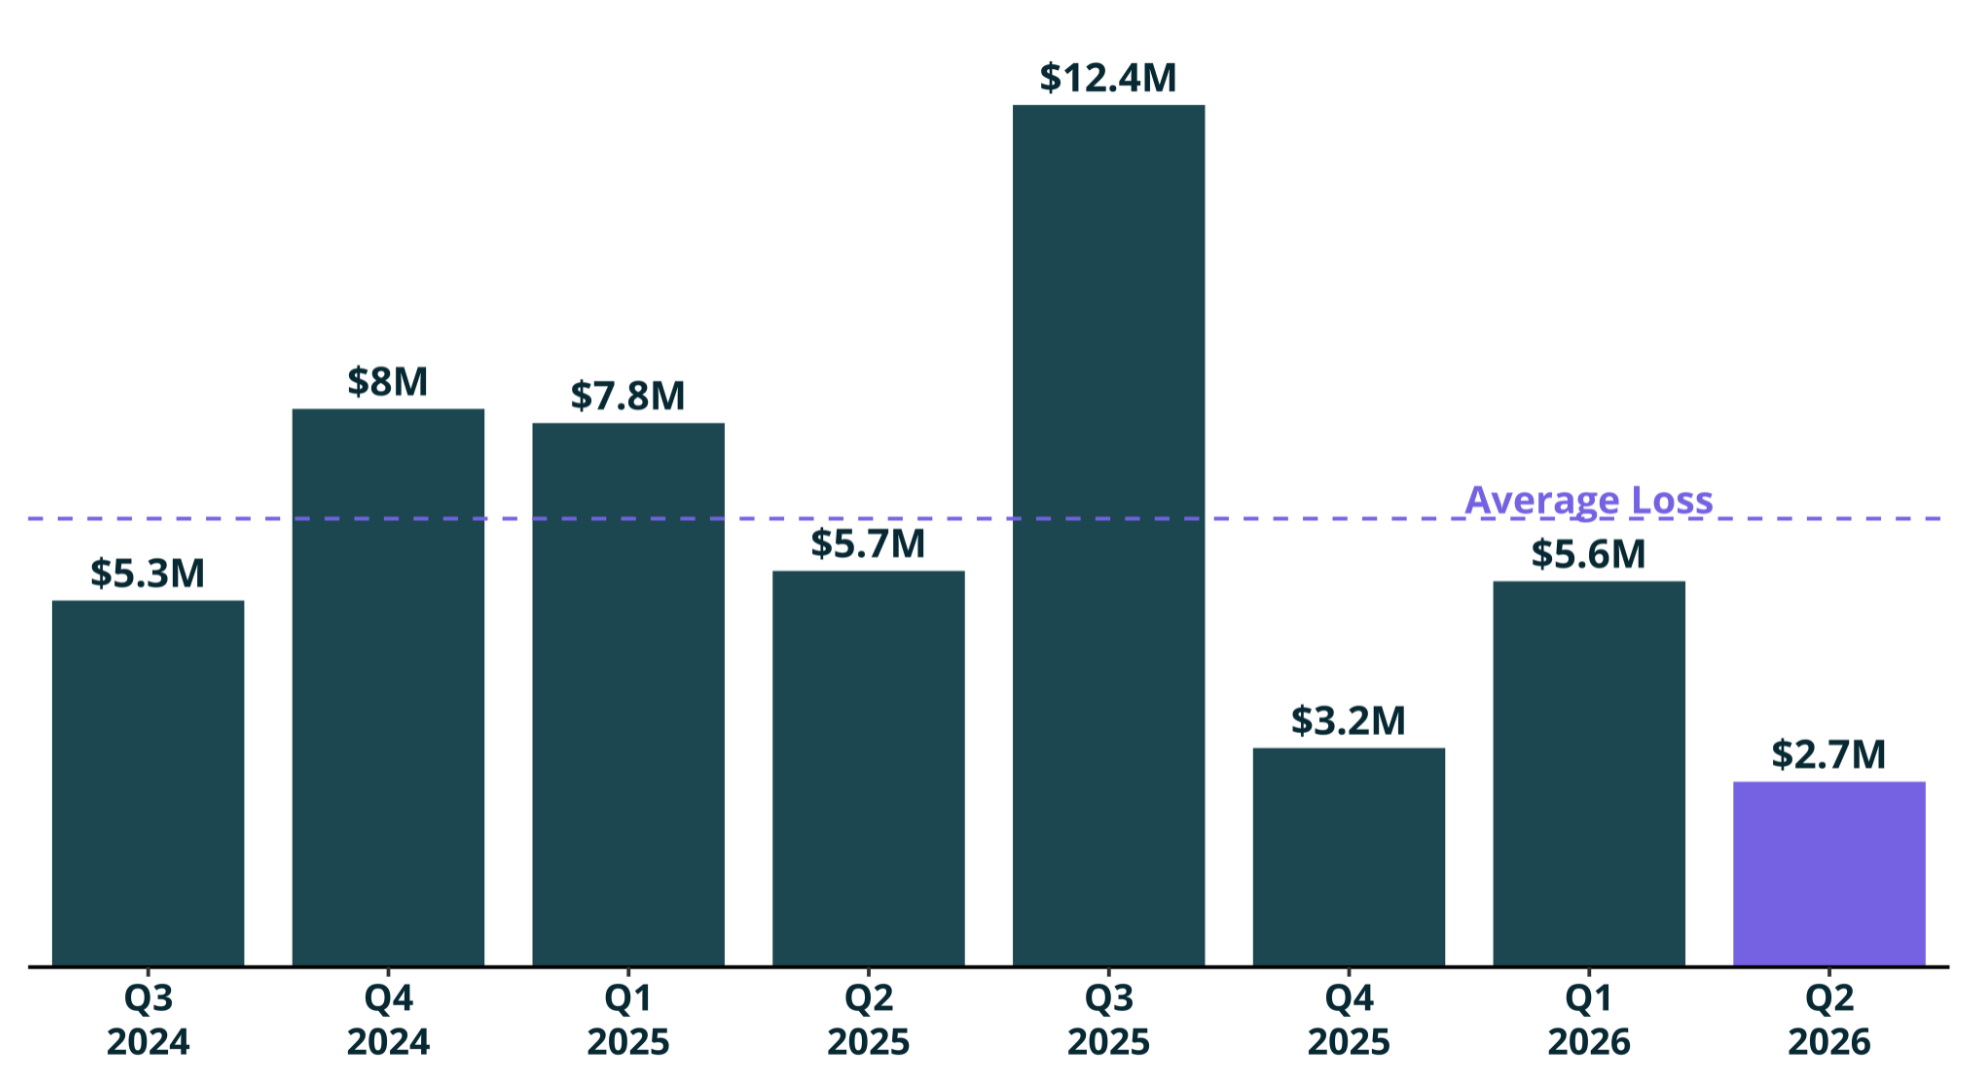
There were 303 incidents reported to the NCSC during Q2 2026 that reported a direct financial loss, and 291 reports that specified the loss amount.
Direct financial losses totalled $2.7 million in Q2 2026, decreasing by 52% compared to last quarter.
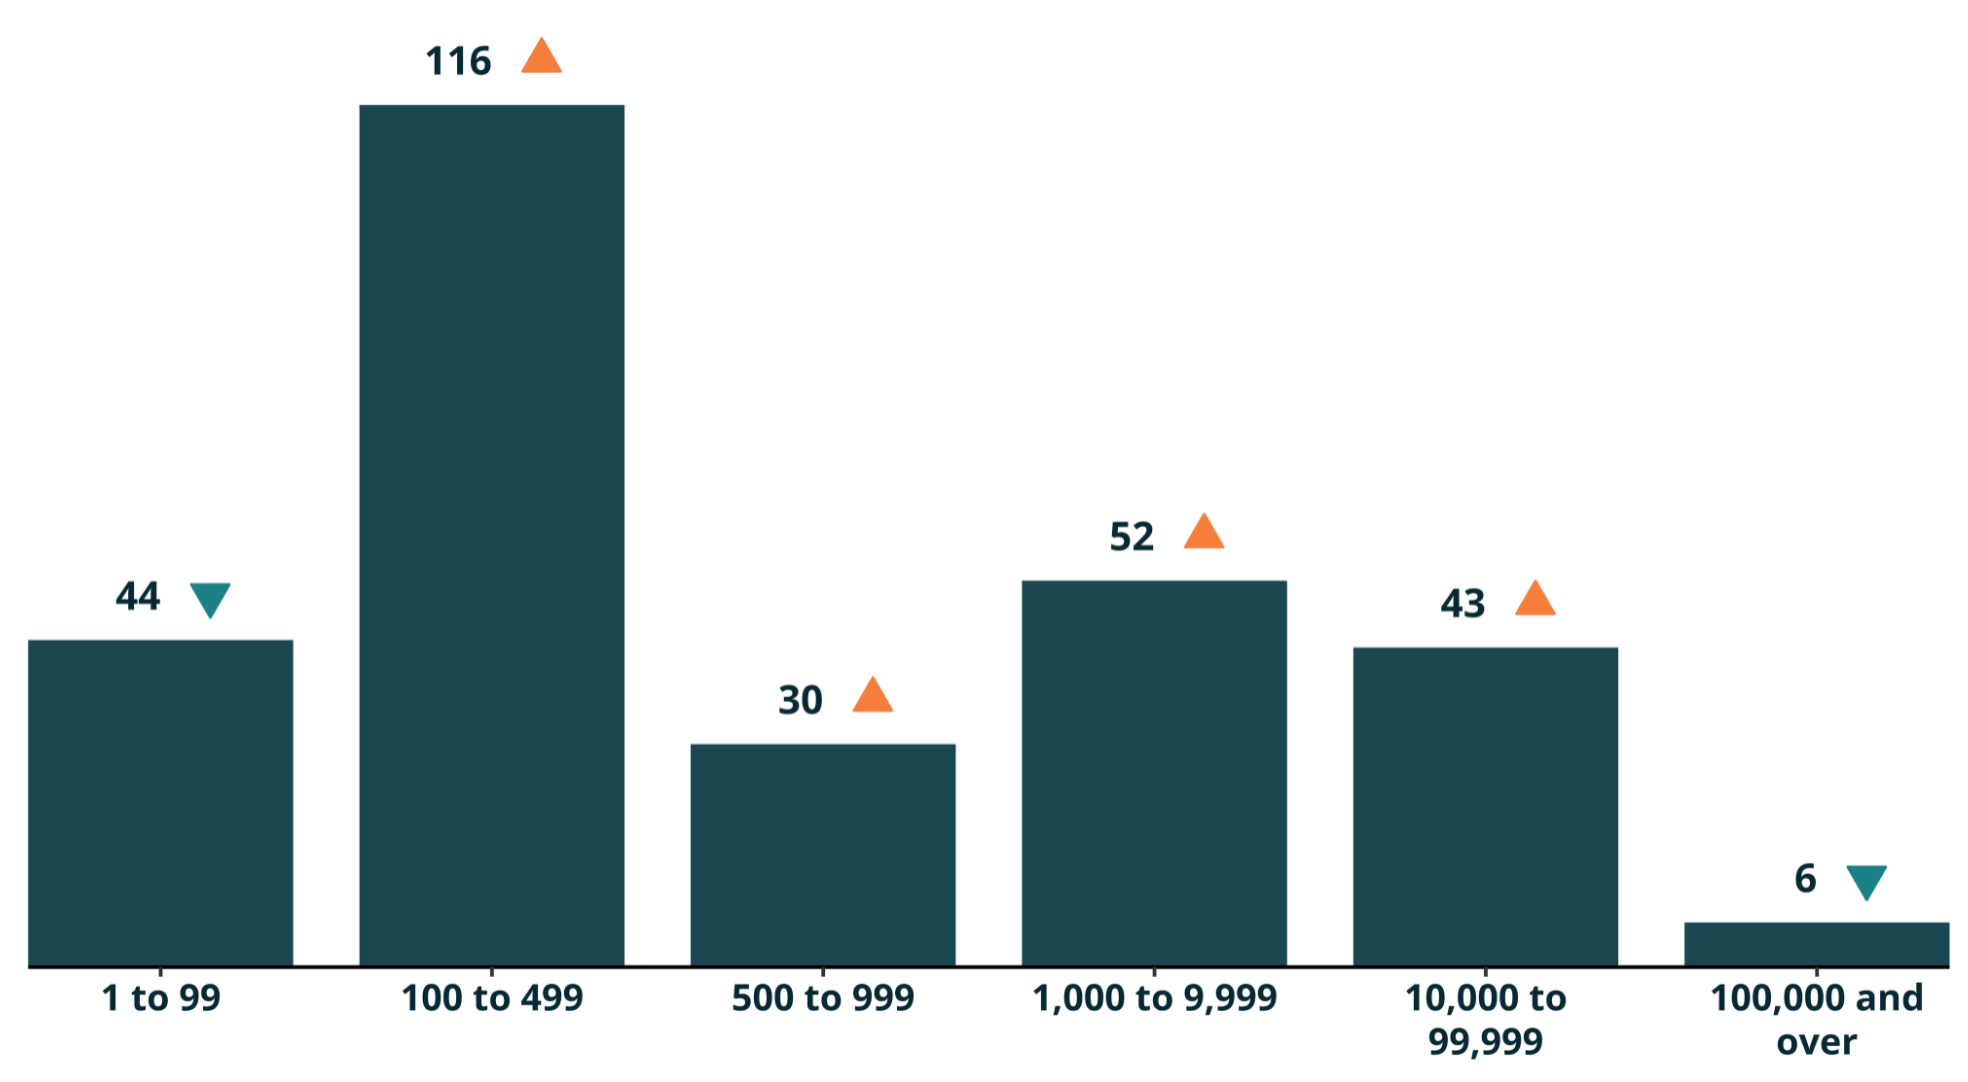
Direct financial loss breakdown
The most common loss value reported sat between $100 to $499 with 116 incidents in this band. Incidents $10,000 and over made up $2.4M (91%) of reported loss despite consisting of only 49 incidents.
Impact: Types of loss
As well as financial loss, the NCSC responded to incidents where other types of loss occurred.
Financial loss: 297 incidents
This includes not only money lost as a direct result of the incident, but also the cost of recovery - for example, the cost of contracting IT security services or investing in new security systems following an incident. (Q1 2026: 283).
Reputational loss: 17 incidents
Damage to the reputation of an individual or organisation as a result of the incident (Q1 2026: 16)
Data loss: 45 incidents
Loss or unauthorised copying of data, business records, personal records and intellectual property (Q1 2026: 56).
Technical damage: <10 incidents
Impacts on services like email, phone systems or websites, resulting in disruption to a business or organisation (Q1 2026: <10).
Operational impacts: 10 incidents
The time, staff and resources spent on recovering from an incident, taking people away from normal business operations (Q1 2026: <10).
Other: 16 incidents
Includes types of loss not covered in the other categories (Q1 2026: 15).